Muscle vs fascia in LBP – The BMAS Blog
Inspired by Cozacov et al 2022 and others.[1–3]
LBP – low back pain
QL – quadratus lumborum
HC – healthy control
US – ultrasound
NRS – numerical rating scale
LTR – local twitch response
FM – fibromyalgia
OA – osteoarthritis
DOMS – delayed onset muscle sorenesskey to acronyms
This is a small but interesting study from Haifa, Israel, published in the journal Bioengineering, which has an impact factor just over 5.
20 patients with either acute (n=5) or chronic (n=15) myofascial pain from QL and 20 healthy controls (HC) were subjected to needling under US control. A 0.30x75mm Chinese needle was inserted subcutaneously, then onto fascia, and finally through into the muscle of QL. At each stage the subject was asked to rate the pain intensity on an NRS of 0 to 100. At each tissue layer the needle was moved in and out in a typical dry needling approach. At the fascial layer, the needle indented the fascia repeatedly without penetrating it. This could be seen easily on US, and there is a supplementary video file showing this. This layer was then penetrated, and the same needling style performed within the muscle layer.
Three different sites in QL were needled and the pain scores were averaged for each tissue layer in each individual. As well as subjective pain scores, the number of LTRs elicited in each layer was also noted by the examiner. The latter could be seen as a more objective measure of irritability and are easily seen when scanning.
Pain was minimal in the subcutaneous layer, and there was no difference between the groups. In the HC group there was no difference in sensitivity between fascia and muscle, but LTRs were more frequent when needling muscle – 6 LTRs in total, 5 of which came from needling muscle and 1 from needling fascia in the HC group.
There was no difference between the acute and chronic myofascial pain groups in either sensitivity to needling or the prevalence of LTRs, but both were significantly greater than that measured in the HC group. Interestingly, the sensitivity of muscle was significantly greater than fascia in the myofascial pain groups, and perhaps not surprisingly, the prevalence of LTRs was also greater in muscle.
the sensitivity of muscle was significantly greater than fascia in the myofascial pain groups, but not in the healthy controls
The second paper I am highlighting is from an American primary care journal.[2] It is a review of IM approaches in a range of conditions. The paper is positive about the use of acupuncture in low back pain and headache, using the term ‘clear benefit’. The term ‘limited benefit’ is used for pain in FM, and ‘some value’ is proposed for improving pain but not function in OA.
Probably the most interesting tables in this paper list the numbers of acupuncturists by state. The average density of acupuncturists across the whole of the United States is 11.63 per 1000 population, but in Hawaii the density peaks at over 50. Oregon, Vermont, and California are all over 30. New Mexico is also in this group but a typo in the paper suggests a much higher density. I think the figure should be 30.27 per thousand rather than the stated 330.27. The latter would mean that every third person you bump into in the street in New Mexico is an acupuncturist – that seems unlikely!
They list 14 states with fewer than 100 acupuncturists. Most are in the Midwest.
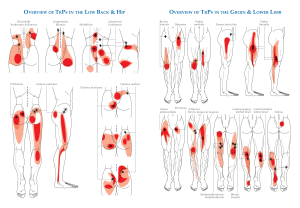
The final paper this week is an experimental paper in healthy young men that mapped out the pressure pain thresholds in the back muscles. The points chosen correlated relatively closely with the points of the Bladder meridian (both inner and outer lines) in the paraspinal thoracolumbar muscles. The points closer to the spine in the thoracolumbar area were consistently less sensitive to pressure.
Having mapped out the varying sensitivities the group went on to test a subgroup following eccentric (lengthening) contractions of these same muscles. Repetitive eccentric contraction of muscle is one of the best ways to create DOMS. Not surprisingly the heat map of PPTs turned lighter red indicating lower PPTs at 24 hours. The pattern was still rather similar, and it returned close to normal levels by 48 hours. I will show you the lovely heat maps at the webinar on Wednesday.
References
1 Cozacov R, Minerbi A, Haddad M, et al. Differential Sensitization of Muscle versus Fascia in Individuals with Low Back Pain. Bioeng Basel Switz 2022;9:440. doi:10.3390/bioengineering9090440
2 Fogleman C, McKenna K. Integrative Health Strategies to Manage Chronic Pain. Prim Care 2022;49:469–83. doi:10.1016/j.pop.2022.01.001
3 Hanada K, Ota H, Mizumura K, et al. Pressure pain threshold map of thoracolumbar paraspinal muscles after lengthening contractions in young male asymptomatic volunteers. Sci Rep 2022;12:15825. doi:10.1038/s41598-022-20071-4
Published by
Published